
MSA 4 — Linearity (Procedure 4)
The MSA Method 4 (Procedure 4 or Linearity Study) tests whether the systematic measurement error (Bias) of a measuring system remains constant across the entire measurement range. While Procedure 1 evaluates the Bias at one point, Procedure 4 examines multiple reference standards that cover the operating range of the measuring device.
my8data combines two evaluations established in practice: the Regression Procedure according to AIAG MSA (4th Edition) and the multiple application of Procedure 1 according to Bosch Booklet 10. The overall assessment corresponds to the combined Bosch form sheet judgment "(min, t-T)".
Overview
Purpose and Field of Application
Procedure 4 answers the question: Is the Bias of my measuring system the same across the entire measurement range — and ideally zero?
A measuring system can be very accurate at one point but deviate upward at the beginning of the measurement range and downward at the end (or vice versa). This variable deviation is called linearity error and becomes visible graphically as the slope of the Bias line.
When is Procedure 4 Used?
- During initial qualification of a measuring system over a larger measurement range (e.g., PPAP)
- When the characteristic is measured over a wide range of values
- When there is suspicion that the Bias is value-dependent
- After calibration/repair, to confirm linearity
Info: Procedure 4 assumes that the repeatability (Repeatability) is already acceptable. Therefore, my8data additionally checks the Cg/Cgk values for each standard (part "min"). If repeatability is poor, the Bias/linearity statement is not reliable.
Typical Workflow
- g ≥ 5 standards selected to uniformly cover the measurement range (validation lock at g < 3)
- Determine the reference value of each standard by higher-order measurement (layout inspection)
- Measure each standard m ≥ 10 times by a normal operator (Bosch example: m = 12)
- Enter measured values in my8data (one row per standard)
- Perform calculation and evaluate diagram + key values
Input
The input is done line by line — one standard per line:
| Column | Content |
|---|---|
| 1 (x_Ref) | Reference value of the standard |
| 2 … N | Individual measured values of this standard (m repetitions) |
Additionally, the following are required in the header:
| Field | Meaning |
|---|---|
| USL / LSL | Upper/lower specification limit → Tolerance T = USL − LSL |
| k-Factor | Spread width factor for Cg/Cgk (Standard: 6) |
| Cg/Cgk Requirement | Minimum requirement per standard (Standard: 1.33) |
| Confidence Level | For the t-tests (Standard: 95 %, corresponding to α = 0.05) |
Warning: With fewer than 25 measurements per standard, a notice appears: The "min" assessment (Procedure 1) is only fully valid according to Bosch Booklet 10 from m ≥ 25. With fewer than 5 standards, my8data points out that Bosch E.1 recommends g ≥ 5.
Tip: The original linearity example from AIAG MSA 4th Edition (Table III-B 4, p. 99) is stored as a standard data set. This allows you to directly verify the calculation against the manual.
Key Values and Assessment
my8data forms two partial assessments and links them with AND:
Part "min" — Procedure 1 per Standard
For each standard, Cg and Cgk are calculated (as in MSA 1):
Cg  = (0.2 · T) / (k · s)
Cgk = (0.1 · T − |Bias|) / (0.5 · k · s)
- s = Standard deviation of the m measurements of the standard
- Bias = x̄ − reference value
- Passed if Cg ≥ 1.33 and Cgk ≥ 1.33 for all standards
Part "t-T" — Regression of Deviations
A fitted line is placed through the Bias values of all standards. Slope and intercept must not deviate significantly from zero:
- Slope a ≈ 0 → the Bias is constant across the measurement range (no linearity error)
- Intercept b ≈ 0 → this constant Bias is also actually zero
Both t-values must fall below the critical t-value (see Derivation).
Overall Assessment
| Part "min" | Part "t-T" | Linearity |
|---|---|---|
| passed | passed | demonstrated |
| not passed | any | not demonstrated |
| any | not passed | not demonstrated |
Important: The primary AIAG criterion is graphical: The "Bias = 0" line must lie completely within the confidence band of the fitted line. The t-tests are the numerical confirmation of this finding.
Derivation and Comparison with the AIAG Manual
This section documents the complete derivation of the regression part ("t-T") and compares it with the AIAG MSA 4th Edition, Chapter III, Section B, "Guidelines for Determining Linearity" (p. 96–101).
1. Data Basis and Bias
For g standards with m measurements each, the signed Bias is formed for each individual measurement (AIAG step 4, p. 96):
bias_ij = x_ij − Reference Value_i
- x_ij = j-th measurement at standard i
- Reference Value_i = known reference value of standard i
Info: Important point of the derivation: The fitted line is not placed through the g Bias averages, but through all gm individual Bias values. In the AIAG slope term, therefore, the denominator is
gm(= total number of individual measurements). my8data calculates exactly this way: x = reference value (repeated m times), y = individual Bias.
2. Fitted Line
For the line y = a·x + b (AIAG p. 96–97):
       Σ(x_i·y_i) − (Σx_i · Σy_i) / gm
a  =  ─────────────────────────────────      (Slope)
          Σ(x_i²) − (Σx_i)² / gm

b  =  ȳ − a · x̄                              (Intercept = Bias at x = 0)
The sums run over all gm value pairs.
3. Residual Scatter (Repeatability)
The standard deviation around the line (AIAG p. 97):
            Σ( y_i − (b + a·x_i) )²
s  =  √  ───────────────────────────
                  gm − 2
This residual scatter s also serves as an estimate of Repeatability for the %EV consideration (AIAG step 7).
4. Hypothesis Tests (Numerical Assessment)
AIAG step 9 (p. 98) tests two null hypotheses with the t-test. With Sxx = Σ(x_i − x̄)²:
H0: a = 0  (Slope)        t_a = |a| · √Sxx / s

H0: b = 0  (Intercept)    t_b = |b| / ( s · √( 1/gm + x̄²/Sxx ) )
Both are tested against the two-sided critical value with gm − 2 degrees of freedom:
t_crit = t( gm−2 ; 1 − α/2 ) (Standard α = 0.05)
Linearity is numerically acceptable if ta ≤ tcrit AND tb ≤ tcrit (neither hypothesis is rejected).
Info: my8data calculates the standard error of the intercept as
s·√(Σx²/(gm·Sxx)). This is algebraically identical to the AIAG forms·√(1/gm + x̄²/Sxx), becauseΣx² = Sxx + gm·x̄².
5. Confidence Band
For each value x₀ (AIAG p. 97):
ŷ(x₀) ± t( gm−2 ; 1−α/2 ) · s · √( 1/gm + (x₀ − x̄)² / Sxx )
If the "Bias = 0" line lies completely within this band, linearity is (graphically) acceptable.
6. Validation Against the AIAG Original Example
The AIAG manual calculates its example (Table III-B 4, p. 99: 5 standards × 12 measurements, reference values 2/4/6/8/10) completely. my8data reproduces the published results exactly:
| Quantity | my8data | AIAG Manual (p. 100/101) |
|---|---|---|
| Slope a | −0.131667 | −0.131667 |
| Intercept b | 0.736667 | 0.736667 |
| Coefficient of determination R² | 71.4 % | 71.4 % |
| t-value Slope t_a | 12.043 | 12.043 |
| t-value Intercept t_b | 10.158 | 10.158 |
| t_crit (58 df; 0.975) | 2.00172 | 2.00172 |
Since ta = 12.043 > tcrit = 2.00172, the hypothesis "Slope = 0" is rejected → linearity problem. This is exactly the manual's conclusion ("there is a linearity problem with this measurement system").
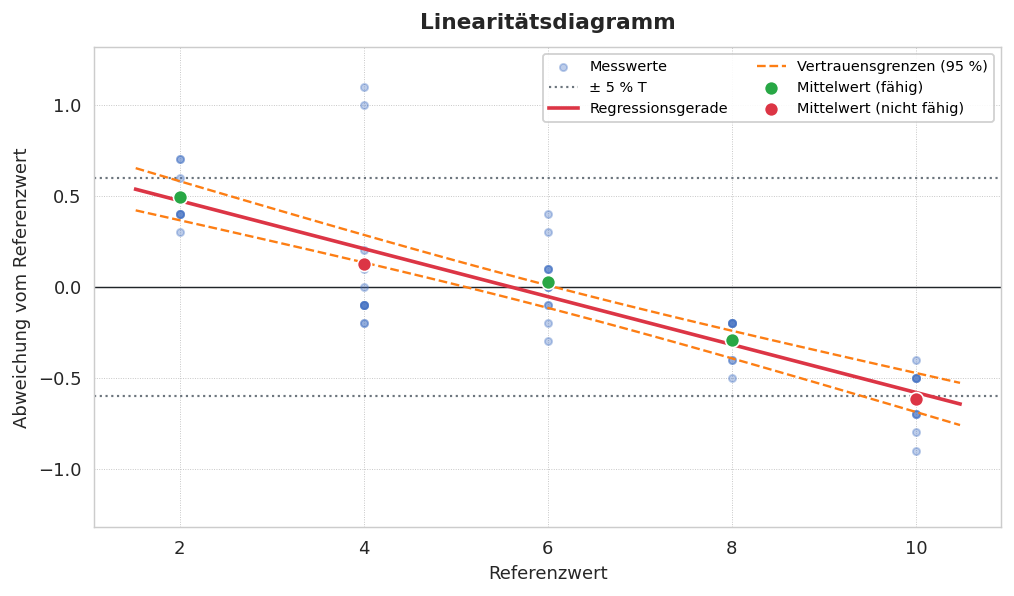
The diagram shows the finding graphically: The regression line (red) clearly declines, and the horizontal "Bias = 0" line (black) is not completely within the confidence band (orange dashed) — it intersects it. The mean values at reference value 4 and 10 are red because the Cg/Cgk criterion ("min") is violated there (reference value 4 because of the bimodal scatter that the AIAG manual explicitly mentions).
Tip: This example is stored as a standard data set. When opening the MSA-4 analysis, you can directly verify the table and diagram above against the result.
7. Deviations and Extensions from AIAG
| Point | AIAG MSA 4th Ed. | my8data |
|---|---|---|
| Regression / t-tests | Core procedure (p. 96–98) | identical, exactly validated |
| Repeatability check | %EV consideration (Step 7) | additionally Cg/Cgk per standard (Bosch Booklet 10, "min") |
| Goodness of fit | qualitative via R² | additionally formal F-test (Lack of Fit) |
| Acceptance | primarily graphical (band) + t-tests | Diagram with band and t-test judgment |
Info: The Bosch extension ("min" via Cg/Cgk) and the F-test go beyond the AIAG minimum, but do not contradict it — they serve the same purpose (Repeatability gate or model quality) in a more rigorous, formally secured manner.
Diagram
Linearity Diagram
The linearity diagram shows:
- Light points: the individual Bias values (deviation of each measurement from the reference value)
- Colored points: the Bias mean values per standard — green if Cg/Cgk is met, otherwise red
- Red line: the fitted line
y = a·x + b - Orange dashed: the confidence band (standard 95 %)
- Black line: the "Bias = 0" line; dotted: the ± 5 % · T lines
How to read the diagram:
- If the line runs horizontal on the zero line, the measuring system is linear and unbiased.
- If the "Bias = 0" line lies completely within the confidence band, linearity is acceptable.
- Intersects the zero line the band (as in the AIAG example), a linearity problem exists.
Important: A low R² is a warning sign that the linear model itself may not be appropriate (e.g., with bimodal data at a standard). In this case, the cause should be investigated before interpreting the t-values.
Run Chart
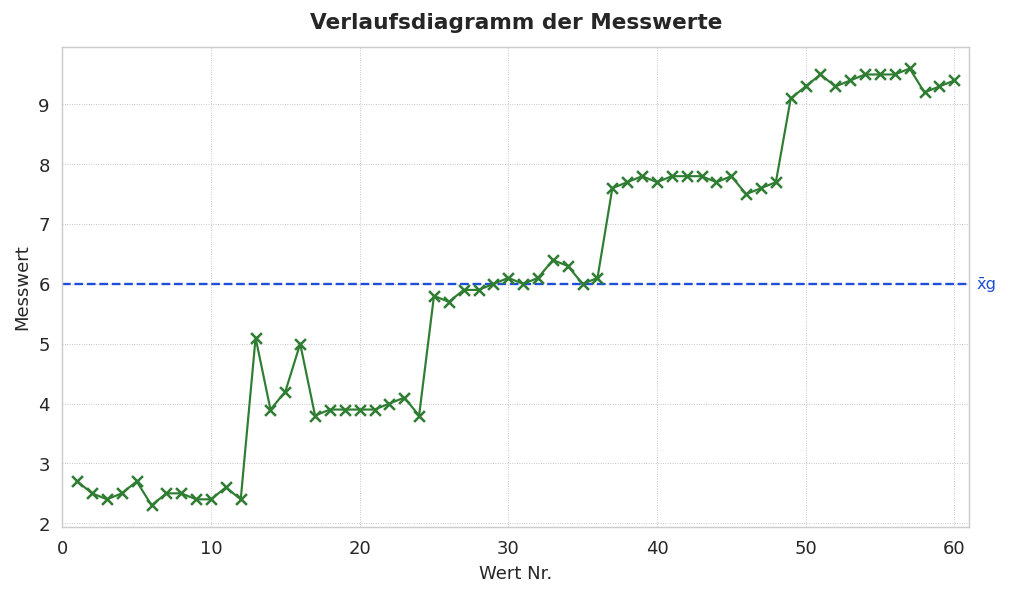
The run chart shows all individual measured values in acquisition sequence (X = running value number, Y = measured value). The dashed line marks the mean value of the reference values (x̄g). It helps to identify temporal anomalies such as trends, jumps, or outliers during the measurement series that are not visible in the linearity diagram.